Class of 2023
.svg)
Employment changes by Year in EWMBA Program. 1st year: 14% company, 26% promotion, 15% function or industry. 2nd year: 26% company, 38% promotion, 33% function or industry. 3rd year: 17% company, 26% promotion, 24% function or industry.
Data is from students surveyed in April 2023. Of 210 students in the class of 2023 reporting being employed, 170 (81%) responded to this survey. The total number or reports may exceed the number of students who reported a changed, as one student can contribute multiple reports based on the different years in which they experienced a change in employment. Data from year 3 includes those who have signed an offer but will start in the role post graduation.

.svg)
Salary By Industry:
- Technology / Telecom: 46.2%, $180,000 median base annual salary, $160,000 25th percentile, $200,000 75th percentile.
- Financial Services: 14.3%, $175,000 median base annual salary, $170,000 25th percentile, $225,000 75th percentile.
- Healthcare: 11.4%, $180,000 median base annual salary, $160,348 25th percentile, $211,250 75th percentile.
- Other: 6.2% $167,000 median base annual salary, $140,000 25th percentile, $200,000 75th percentile.
- Consulting: 4.3%, $175,000 median base annual salary, $170,000 25th percentile, $192,000 75th percentile.
- Energy: 4.3%, $170,000 median base annual salary, $160,650 25th percentile, $205,500 75th percentile.
- CPG: 3.3%, $170,000 median base annual salary, $160,500 25th percentile, $192,500 75th percentile.
- Manufacturing: 2.9%, $161,900 median base annual salary, $156,250 25th percentile, $180,450 75th percentile.
- Media/Entertainment: 2.9%, %235,000 median base annual salary, $187,000 25th percentile, $400,000 75th percentile.
- Non-Profit/Education: 1.4%, $144,473 median base annual salary, $136,897 25th percentile, $157,237 75th percentile.
- Real Estate: 1.4%, I/D median base annual salary, I/D 25th percentile, I/D 75th percentile.
- Government 1.0%, I/D median base annual salary, I/D 25th percentile, I/D 75th percentile.
- Transportation/Logistics 0.5%, I/D median base annual salary, I/D 25th percentile, I/D 75th percentile.
Percentages based on 210 students reporting being employed in the Class of 2023. Of those 210, 207 reported base salary data.
Industries represented by Other: Aerospace,/Aviation Defense, Agribusiness, Construction, Engineering Services, Retail. I/D denotes insufficient sample size.

.svg)
Salary by Function:
- Information Technology 28.6%, $184,500 median base annual salary, $163,500 25th percentile, $210,000 7th percentile.
- Finance 16.7%, $175,000 median base annual salary, $165,000 25th percentile, $203,750 percentile.
- Marketing/Sales 14.3%, $172,335 median base annual salary, $165,000 25th percentile, $200,750 75th percentile.
- General Management 13.3%, $175,000 median base annual salary, $155,000 25th percentile, $200,000 75th percentile.
- Other 12.9%, $182,500 median base annual salary, $157,500 25th percentile, $207,500 75th percentile.
- Consulting 8.6%, $174,440 median base annual salary, $152,663 25th percentile, $195,000 75th percentile.
- Operations 2.9%, $181,500 median base annual salary, $147,250 25th percentile, $217,500 75th percentile.
- Accounting 1.0%, I/D median base annual salary, I/D 25th percentile, I/D 75th percentile.
- Human Resources 1.0%, I/D median base annual salary, I/D 25th percentile, I/D 75th percentile.
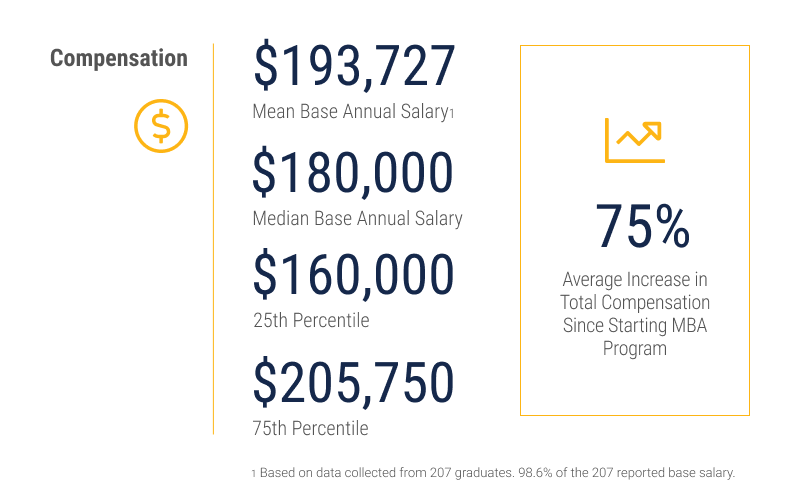
- Total: 100%, $180,000 median base annual salary, $160,000 25th percentile, $205,750 75th percentile.
Percentages based on 210 students reporting being employed in the Class of 2023. Of those 210, 207 reported base salary data. I/D denotes insufficient sample size.
Top Employers
Logos for Amazon, Apple, Genentech, Google, Intel, JP Morgan Chase, Linkedin, Meta, and Salesforce.
Top employers hired 3 or more students.